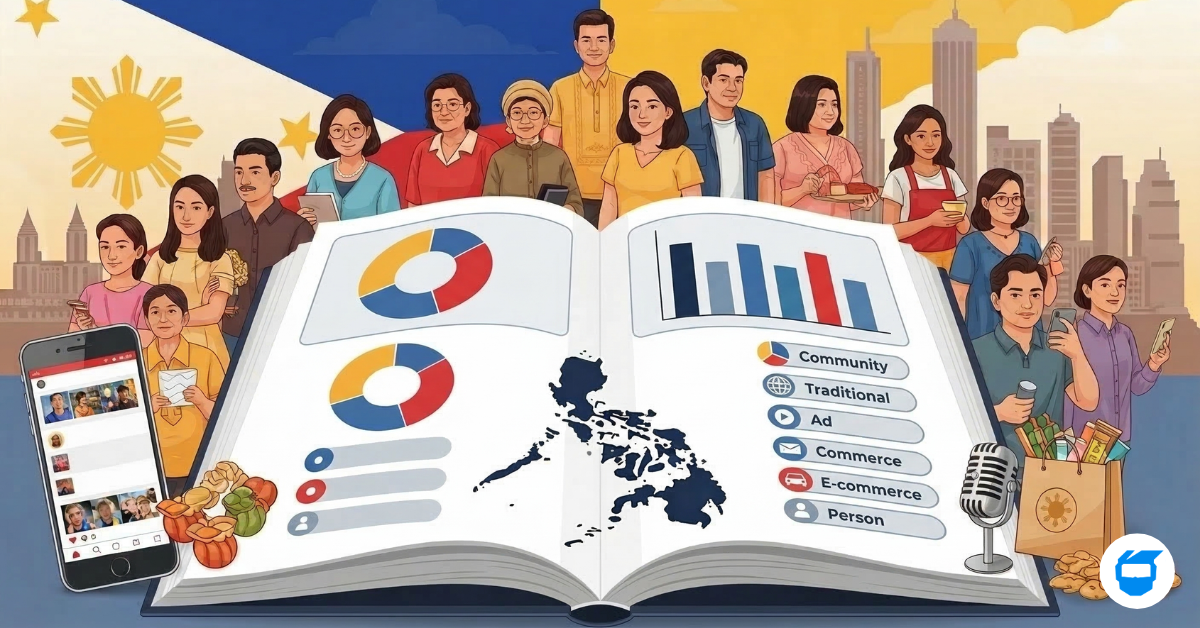
How to Market to Every Filipino: A Complete Guide to SEC Classes A to E (2026)

The Philippines is one of Southeast Asia’s most dynamic consumer markets — but also one of its most unequal. Filipino consumers don’t behave as one homogenous group. The Class A executive in Bonifacio Global City who shops at Rustan’s lives in an entirely different reality from the Class D tindahan owner in Cebu who tops up her GCash every payday.
Getting this distinction right is the difference between a campaign that resonates and one that burns budget. This guide breaks down all five socioeconomic classes using the marketing industry’s SEC A–E framework — cross-referenced with population data from Social Weather Stations (SWS), income data from the Philippine Statistics Authority (PSA), and economic research from the Philippine Institute for Development Studies (PIDS) — and translates those insights into concrete, actionable marketing playbooks.
One thing worth stating before we dive in: this guide uses socioeconomic classes as analytical tools — not as labels for how much a person matters. The Class D driver and the Class E farmer are not audience segments to be optimized. They are Filipinos making rational decisions with the resources available to them. The brands that last in this market are not the ones that extract the most from the lowest incomes — they’re the ones that show up honestly, price fairly, and deliver real value. That’s not idealism. It’s the only strategy that builds lasting loyalty.
Key Takeaways at a Glance
The eight most important facts every Philippine marketer should know before running a campaign.
- 01The SEC A–E system is a marketing convention, not a government standard. Income brackets are industry estimates developed by private research firms. The PSA, SWS, and PIDS each use different classification methods — none officially publish A–E income brackets. No direct mapping exists between government data and the marketing framework.
- 02Classes D and E combined represent 87.4% of Philippine households. Per SWS September 2024 (n=1,500 national sample), measured by dwelling quality. This is not a niche — it is the market. Any brand targeting only Classes A, B, and C is addressing 12.6% of Filipino households.
- 03The Class D/E income boundary is ₱13,873/month for a family of five. This is the PSA’s official 2023 poverty threshold — the only government-published anchor point for the lower end of the SEC income pyramid. It rose 15.3% from ₱12,082 in 2021, driven by food price inflation.
- 04Low-income families spend 56.9% of their total budget on food — more than double the share of high-income families. Middle-income: 42.8%. High-income: 22.9% (PIDS, FIES 2018 data). The lower the class, the less remains for non-food spending. Any product that displaces a food peso faces a significantly higher barrier to trial.
- 05NCR families earn 2.5× more than BARMM families on average. NCR: ₱513,520/year. BARMM: ₱206,880/year (PSA FIES 2023 preliminary). A national campaign priced and messaged for Metro Manila will miss badly in Mindanao and rural Visayas. Regional calibration is not optional.
- 06Facebook is the dominant platform across all five classes — but how each class uses it is completely different. Class A and B: news and community. Class C: live selling and e-commerce discovery. Class D: Facebook is effectively the internet, accessed primarily via prepaid mobile data. Same platform, entirely different behavior and intent.
- 07TikTok Shop is the fastest-growing conversion channel for Class C. TikTok’s ad reach in the Philippines grew to 62.3 million users in early 2025. For households earning ₱30,000–₱80,000/month, TikTok Shop paired with micro-influencers (10K–100K followers) consistently outperforms celebrity endorsement on cost-per-conversion.
- 08Internet access is deeply uneven — 79.3% in NCR versus 40.0% in BARMM. Source: PSA-DICT National ICT Household Survey 2024. Digital-first is appropriate for Luzon urban centers. For Mindanao and rural Visayas, radio, out-of-home, and on-ground activation deserve primary budget allocation — not as a backup, as a strategy.
The Philippine Income Pyramid
The Philippine socioeconomic classification (SEC) groups households by income into five classes — A (richest) to E (poorest). Understanding their relative size is the first step to allocating your marketing budget correctly.
Population Distribution by SEC Class
Note: Population distribution per SWS Sept. 2024 (ABC combined = 5.8%; D+E = 87.4%). Income ranges are inflation-adjusted estimates — not official government figures. See framework notes below.
A note on these classifications: The income brackets and behavioral patterns in this guide are based on aggregate survey data and population-level research. They represent general tendencies, not absolute rules. Individual consumers within any class will always vary — a Class D household may prioritize premium coffee, and a Class B household may be just as price-sensitive as Class C in certain categories. Use these segments as a starting framework, then refine based on your own customer data and campaign results.
About the SEC A–E classification: The Class A-to-E framework used in this guide is a marketing industry convention, not an official government classification. It was developed by private market research firms in the Philippines for audience segmentation in advertising and media planning, and is widely used by agencies, brands, and media buyers across the country. It is not published or maintained by the PSA, SWS, or any government body. When SWS or PIDS data is cited in this article, it reflects the closest available research mapped to this framework — the underlying methodologies differ. Income brackets shown are estimates based on widely cited 2012 Philippine marketing benchmarks, adjusted for approximately 58% cumulative CPI inflation (BSP, 2012–2025), anchored against the PSA poverty threshold (₱13,873/month for a family of five, PSA 2023 full-year poverty statistics). Exact cutoffs are not government-defined and will vary by research firm.
Class A – The Elite
Filipino population estimates per class are derived from SWS household percentages (Sept. 2024) applied to the 117M national population estimate (PSA 2025). Because average household sizes differ significantly by income class — ranging from ~4.2 members for middle-income to ~5.3 for low-income households (PIDS, FIES 2021) — these figures are approximations, not official population counts by socioeconomic class.
1% of households
approx. 1M Filipinos
- 🏘️ Exclusive private villages and high-end enclaves — Forbes Park, Dasmarinas Village, Ayala Alabang, BGC
- 💼 C-suite executives, business owners, heirs to conglomerates
- 🎓 Educated abroad (Ateneo, La Salle, UP + international degrees)
- ✈️ Travel internationally 4–6× per year, leisure and business
- 🚗 Own 2–5 luxury vehicles (BMW, Mercedes, Range Rover)
- 📱 Early tech adopters — latest iPhone, premium gadgets
- 💎 Luxury goods — Hermès, Louis Vuitton, Rolex
- 🍽️ Fine dining (Gallery by Chele, Metronome)
- 🏥 Concierge medicine, private hospitals abroad
- 📚 Private schools — International School Manila, Brent
- 🏌️ Golf clubs, yacht clubs, Polo Club memberships
- 🏠 Real estate investment — condos, provincial estates
The SWS September 2024 survey found that Classes A, B, and C combined account for just 5.8% of the Philippine population — meaning the true Class A alone represents well under 1% of all Filipino households. This is a marketing industry estimate; SWS measures this using a dwelling-quality and asset-based observation method, not the income brackets shown above.
How to market to Class A
Quiet luxury
Private events
Referral & WOM
Premium editorial
White-glove service
Selective digital
Philippine brands targeting this class
Class B – The Aspirational Achievers
3–4% of households
approx. 4–5M Filipinos
- 🏘️ Private villages, gated subdivisions, mid-range condominiums, and townhouses — Filinvest, Megaworld, SMDC, DMCI
- 💼 Senior managers, doctors, lawyers, successful SME owners
- 🎓 Ateneo, DLSU, UP ± international exposure
- ✈️ Travel regionally — Japan, South Korea, Singapore — 1–3×/year
- 🚗 Mid-to-premium cars — Honda CR-V, Toyota Fortuner, Mazda CX
- 💻 Digitally savvy; heavy Instagram and YouTube users
- 👗 Aspirational brands — Michael Kors, Coach, Zara premium lines
- 🍕 Upscale casual dining — Hole in the Wall, Ramen Nagi, Dad’s
- 🏋️ Premium gym memberships — Anytime Fitness, Edge Fitness
- 🏠 First-time condo buyers — SMDC, Megaworld, Ayala Land
- 🌿 Wellness, organic products, Korean beauty
- 📦 Active Lazada/Shopee mid-to-high tier shoppers
PSA FIES 2023 reported that the NCR’s average annual family income reached ₱513,520 — roughly ₱42,793/month — the highest in the country. Class B households predominantly cluster in Metro Manila, CALABARZON, and Metro Cebu, where economic opportunities are most concentrated.
How to market to Class B
Aspirational storytelling
Instagram & YouTube
Property & investment
Premium flash sales
Video content
Email & loyalty
Philippine brands targeting this class
Class C – The Middle Class
13% of households
approx. 13–16M Filipinos
- 🏘️ Non-exclusive subdivisions, mixed neighborhoods, rented apartments or low-cost condominiums — concrete homes, generally without private village access
- 💼 BPO/call center agents, private sector employees, teachers, nurses, OFW families
- 🎓 College-educated; 40.6% of the middle class holds a degree (PIDS, FIES 2021)
- 📱 Smartphone-first; heavy Facebook, TikTok, and YouTube users
- 🚗 Toyota Vios, Honda City, or motorcycle
- 🛒 Shopee and Lazada power users; love flash sales and vouchers
- 🍽️ ~43% of income on food — less than lower classes but still a major constraint
- 👟 Mid-market brands — H&M, Bench, Penshoppe, SM basics
- 🍔 Fast casual — Jollibee, McDonald’s, Mang Inasal (frequent)
- 💰 Installment buyers (Home Credit, 0% credit card offers)
- 📦 Value packs, multi-buy deals, buy-one-get-one
- 🏥 PhilHealth-dependent; occasional private clinic
A PIDS analysis using FIES 2021 data estimated roughly 40% of Philippine households fall into a broad “middle income” band — but this uses a different methodology than the SEC marketing framework. PIDS defines middle income as households earning between 2× and 12× the official poverty threshold, a range that overlaps across marketing Classes B, C, and the upper end of D. Critically, PIDS also notes that roughly 30% of all Philippine households are vulnerable to falling back into poverty due to economic shocks — meaning many Class C families are not stable middle class but precarious middle class. This vulnerability shapes how they spend and what messaging resonates.
How to market to Class C
Value + security
TikTok & Facebook
Micro-influencers
E-commerce promos
GCash & Maya tie-ups
Aspirational + practical
Philippine brands targeting this class
Class D – The Working Class
75% of households
approx. 75–88M Filipinos
- 🏘️ General neighborhoods, lower-cost subdivisions, rented apartments, some informal settlements
- 💼 Drivers, construction workers, factory workers, tindahan/sari-sari owners, market vendors
- 🎓 High school graduate or some college; limited access to tertiary education
- 📱 Predominantly Facebook users; mobile internet via prepaid SIM — data is budgeted carefully
- 🏍️ Motorcycle, tricycle, jeepney as primary transport
- 💊 Depends on barangay health centers, PhilHealth, and generic medicines
- 🍚 ~57% of total expenditure on food — nearly every peso is allocated before it arrives
- 📦 Sachet economy — single-use sachets of shampoo, coffee, condiments — not poverty, but rational cash-flow management
- 🏪 Sari-sari store as primary retail channel; palengke for fresh goods
- 💳 Cash-based; limited credit. GCash used mainly for remittances and load
- 📺 Free TV (GMA, online content), AM radio, Facebook
- 🤲 Heavy reliance on community, barkada, and suki relationships for brand trust
SWS September 2024 showed Classes D and E at a combined 87.4% of the national sample — making this the dominant consumer segment in the Philippines. Low-income families (Classes D and E) spend approximately 56.9% of total expenditure on food alone (PIDS, using FIES 2018 data). Facebook reaches them almost universally, with over 90 million active Philippine users — but Class D Filipinos access it primarily via prepaid data, meaning short-form content dramatically outperforms long-form video on load time and completion rate.
Class D consumers are experienced buyers who have been targeted by brands their entire lives and know exactly when they’re being talked down to. The sachet economy is often framed as a sign of deprivation — it is more accurately a rational response to weekly cash flow. Brands that treat Class D Filipinos as intelligent adults with real preferences, not just cost constraints, build the kind of loyalty that no campaign budget can replicate. Condescending advertising, inflated prices on small units, and exploitative credit terms all get noticed — and talked about.
How to market to Class D
Sachet strategy
Facebook-first, light content
Suki loyalty
Radio & free TV
Tarpaulin & OOH
Word of mouth
Philippine brands targeting this class
Class E – The Poverty Segment
47% self-identify as poor (SWS Jan 2024)
approx. 8–17M Filipinos*
- 🏚️ Informal settlements, urban slums, remote barangays — temporary or makeshift structures
- 💼 Subsistence farmers, fishermen, informal vendors, day laborers
- 📚 Elementary-level education or less; high dropout rate
- 📱 Shared smartphone or second-hand device; free/subsidized data access where available
- 🏥 Dependent on Malasakit Center, 4Ps, and government health programs
- 👨👩👧👦 Larger family sizes — avg. 5.3 members vs. 4.2 for middle class (PIDS, FIES 2021)
- 🌾 Food consumes the overwhelming majority of income — rice, sardines, instant noodles
- 💧 Utilities — water, minimal electricity — are a significant strain
- 📦 Absolute sachet economy — one-use packaging is not a preference, it is the only accessible format
- 🤝 Barter, community sharing, and mutual aid supplement formal purchasing
- 📺 Free TV, communal viewing; AM radio heavily consumed
- 💊 Generic medicine only; healthcare is often deferred, not chosen
The PSA set the official poverty threshold for a family of five at ₱13,873/month in 2023 — up 15.3% from ₱12,082 in 2021, driven by food price inflation (PSA full-year poverty statistics, released July 2024). At the individual level, 15.5% of Filipinos (17.54 million people) were classified as poor in 2023. While SWS data places Class E at approximately 6.8% of households by dwelling quality, a January 2024 SWS survey found around 13 million households (47%) self-identified as poor — a reminder that the boundary between D and E is felt more than it is measured. Internet access in this segment remains deeply uneven: BARMM recorded just 40.0% individual internet use in 2024, versus 79.3% in NCR (PSA-DICT NICTHS 2024).
Brands marketing to Class E are operating in communities where income is genuinely precarious and every peso carries weight. Misleading health claims, hidden fees, exploitative interest rates, and artificially inflated unit prices in small formats cause real harm at this income level — harm that doesn’t show up in your campaign dashboard but does show up in people’s lives. The brands that endure here do so because they deliver honest value, price fairly, and show up consistently. Marketing to Class E is not just a targeting challenge. It carries a responsibility that higher-income segments do not.
How to market to Class E
Basic needs focus
Community radio
Community outreach
Sampling & demos
CSR as commitment
Jeepney & tarp ads
Philippine brands targeting this class
* Class E population range reflects the gap between PSA’s official poverty incidence (15.5% of individuals, ~18M people as of 2023) and SWS dwelling-quality classification (~6.8% of households). The wider range accounts for both measures.
Which Platform for Which Class?
Where each socioeconomic class spends their time online — and how smart brands should allocate their digital budget accordingly. ✓✓ = primary platform for that class · ✓ = relevant but secondary.
TikTok
YouTube
Radio & Free TV
Sources: NapoleonCat (Dec 2024), DataReportal Digital 2025: Philippines, Meltwater 2025. Internet access by region: PSA-DICT National ICT Household Survey 2024 — 67.3% of Filipinos aged 10+ used the internet in 2024; household internet access ranged from 68.7% in NCR to 27.7% in BARMM. These regional gaps directly affect channel strategy for brands operating outside Metro Manila.
Key Marketing Principles Across All Classes
Regardless of which segment you’re targeting, these six principles hold true for every Filipino consumer market.
Mobile Is Non-Negotiable
87.64% of web traffic in the Philippines comes from mobile. Every marketing touchpoint — from your landing page to your checkout — must be built mobile-first. For Classes C and D, also optimize for slow connections and prepaid data constraints.
Facebook Is Still King for Volume
With 90.8 million potential ad reach, no other platform matches Facebook’s ability to reach all five classes at scale. Even Class A uses it for news and community. But the platform behaves very differently by class — strategy must adapt accordingly.
The “Masses” Are Your Real Market
Classes D and E represent over 87% of Philippine households. If your product can’t penetrate this segment, you’re leaving the majority of potential volume untouched. Volume in this market is won by showing up consistently at the community level — not by outspending on digital alone.
TikTok Is the Rising Force
TikTok’s ad reach grew to 62.3 million Filipinos by early 2025. TikTok Shop is rapidly becoming a critical commerce channel for Class C and D buyers. Short-form video also performs better on limited prepaid data — functional, not just trendy.
Trust Beats Awareness
Across all classes, Filipinos buy from people and brands they trust. Whether it’s a suki relationship in Class D or a VIP concierge for Class A, relationship-first marketing wins. Brands that treat customers as intelligent adults — regardless of income level — compound that trust over time.
Localize to the Region
NCR’s average family income (₱513,520/year) is 2.5× that of BARMM (₱206,880/year) — and BARMM households spend 57.5% of their budget on food versus 39% in CALABARZON (PSA FIES 2023). Internet access also drops to 40% in BARMM versus 79.3% in NCR. Metro Manila messaging, pricing, and channel mix will miss badly in Mindanao and rural Visayas.
Which Class Should You Target?
Not sure where your product or service fits? Use this quick reference to identify your primary target segment based on what you’re selling.
Match Your Offer to the Right SEC Class
Find your product or service type and see which class to prioritize.
Frequently Asked Questions
What are the SEC Classes A, B, C, D, and E in the Philippines?
Which social media platform should I use to reach Class D Filipinos?
How big is the middle class in the Philippines?
What marketing strategy works best for Philippine SMEs targeting the mass market?
Final Thoughts
Marketing in the Philippines is not a one-size-fits-all game. The country’s income pyramid is steep, its digital landscape is fragmented across platforms and device types, and consumer trust is earned very differently depending on the class you’re speaking to. Class A responds to exclusivity and private access. Class B chases aspiration and lifestyle signals. Class C wants value without sacrificing identity — and increasingly, financial security alongside aspiration. Class D is loyal, community-driven, and deeply Facebook-first. Class E prioritizes survival — and brands that show up genuinely at the community level earn loyalty that no ad budget can buy.
Here is what the data keeps saying, in different ways: the 87% of Filipinos in Classes D and E are not an audience to be optimized. They are people who are extraordinarily good at spotting when a brand respects them and when it doesn’t. The FMCG giants that have built generational loyalty in these segments — the Lucky Me’s, the Safeguards, the Mang Inasals — did it by pricing honestly, showing up consistently in the community, and delivering products that actually worked. That’s the standard. Not because it’s the ethical thing to do (though it is), but because it’s the only thing that compounds.
The businesses that win in this market are the ones that resist the urge to broadcast a single message to everyone. They invest in understanding who they’re talking to, meet that audience on their preferred channel, speak in the right tone, and price accordingly. Whether you’re an FMCG brand targeting Class D through sari-sari stores or a real estate developer pitching condos to Class B on Instagram — the strategy lives or dies on how well you know your segment.
Use this guide as a starting point. Revisit it as the data evolves. And when you’re ready to turn these insights into campaigns that actually move the needle — that’s where we come in.
Let’s Build a Campaign That Actually Works
WAZILE is a premier digital marketing and web design agency based in the Philippines. We help businesses pinpoint their ideal audience, craft compelling messaging, and execute high-converting campaigns across the most effective channels — from Facebook ads and TikTok content to cutting-edge website design and Generative Engine Optimization (GEO).
Let’s Talk StrategyData Sources & References
All statistics cited in this article are sourced from government institutions, academic research, and established market intelligence firms.
- [1]Philippine Statistics Authority – Family Income and Expenditure Survey (FIES) 2023 Preliminary Results — national and full regional average family income
- [2]Philippine Statistics Authority – 2023 Full-Year Official Poverty Statistics (released July 2024) — poverty threshold ₱13,873/month, poverty incidence 10.9% families / 15.5% individuals
- [3]Philippine Institute for Development Studies (PIDS) – Socioeconomic Classes Income Groups (via FOI, September 2024), citing FIES 2021 analysis
- [4]Mahar Mangahas, Philippine Daily Inquirer – “Measuring the Middle Class” (December 2024) — SWS Sept. 2024 survey data and full verbatim SWS housing classification guidelines (AB, C, D, E)
- [5]Mahar Mangahas, Philippine Daily Inquirer – “Counting the Social Classes” (September 2022) — 1SEC history, ABCDE methodology, PIDS income class definitions
- [6]PIDS – “The Middle Class in the Philippines: Growing But Vulnerable” (2024) — FIES 2021 middle-class size, vulnerability incidence, family size, education and employment characteristics
- [7]PIDS Discussion Paper 2020-22 – “Poverty, the Middle Class, and Income Distribution amid COVID-19” — food expenditure shares by income class: low-income 56.9%, middle 42.8%, high-income 22.9%
- [8]Philippine Statistics Authority / DICT – National ICT Household Survey (NICTHS) 2024 (released July 2025) — 48.8% household internet access nationally; individual users 67.3%; NCR 79.3% vs. BARMM 40.0%
- [9]DataReportal – Digital 2025: Philippines (February 2025) — internet users, social media reach, platform statistics
- [10]Meltwater / We Are Social – “Social Media Statistics in the Philippines 2025/2026”
- [11]NapoleonCat – Social Media Users in the Philippines, December 2024
- [12]MoneyMax.ph – “Social Classes in the Philippines: Which Class Do You Belong To?” (Updated 2023)
- [13]Spiralytics – “Social Media in the Philippines Facts and Statistics 2025”
- [14]Bangko Sentral ng Pilipinas (BSP) – CPI and Inflation Rate Historical Data (2012–2025) — used to calculate ~58% cumulative inflation adjustment for SEC income bracket estimates
- [15]Bangko Sentral ng Pilipinas – Consumer Finance Survey 2021 — national household spending patterns: food at home 55.4%, housing/utilities 10.6%, transportation 7.2%