8 Facebook Statistics That Every Business Needs to Know in 2026 (Infographic)
Out of all the popular social media platforms today, Facebook remains at the top and continues to improve its features to suit the needs of its users. With the number of users and marketing features that Facebook has, it is seen as a viable platform by businesses to effectively market their brand and reach their target market where they are. So if you are using Facebook as one of the platforms to engage your audience, it is best to know the essential statistics to help you plan out your next social media marketing campaign.

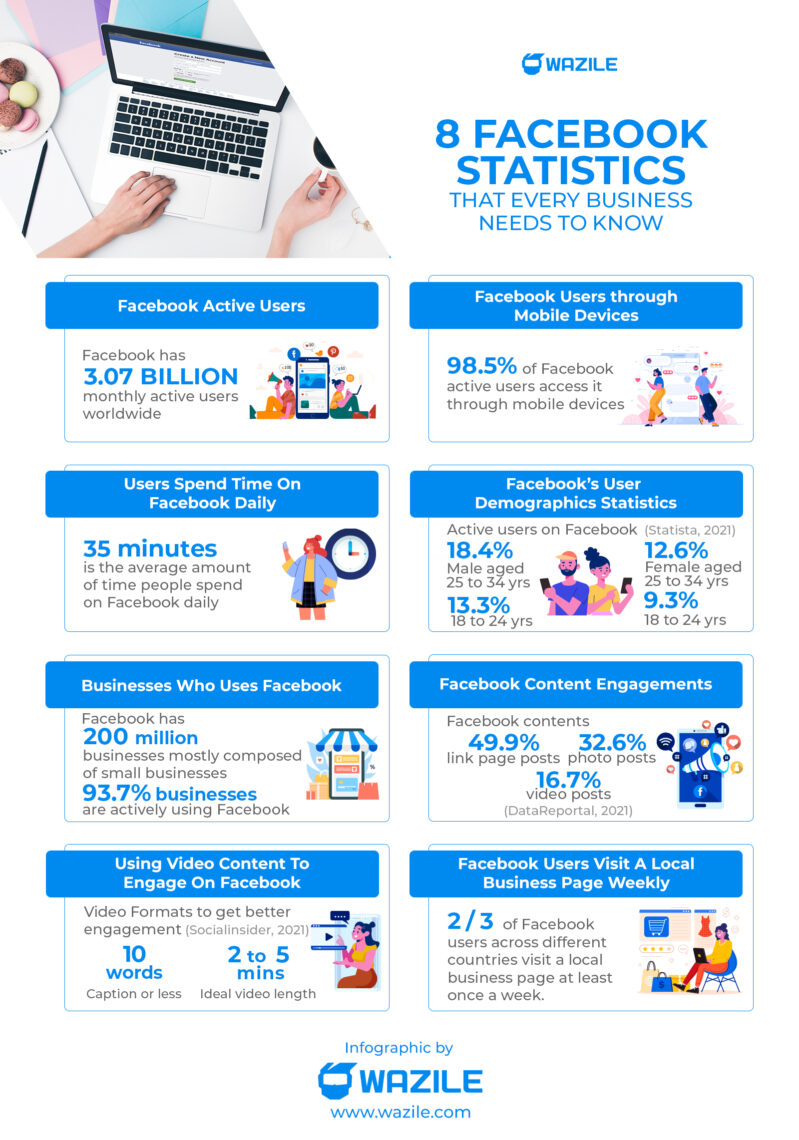
To help you with that, here’s an Infographic for Facebook Statistics:
1. How Many Users Does Facebook Have Worldwide?
With Facebook getting the third spot in the most visited websites worldwide, it also holds a large number of users. Facebook has 3.07 billion monthly active users worldwide. This means that out of the large number of users that Facebook has, many businesses can potentially reach their target audience through the platform. Given its popularity and handy business tools features, Facebook makes a competitive social media platform that businesses eye for social media marketing.
2. How Many Users Access Facebook Through Mobile Devices?
98.5% of active users access Facebook through their mobile devices. This is an important stat that businesses should take note of because when you are trying to reach your target audience, you should know what devices they usually use to access online content. Why? So you can simply tailor your posts to something that will suit your audience’s viewing devices and preferences. It is the same as making your web design mobile responsive so your audience can access your website not only through their desktops but also through their mobile devices.
3. How Much Time Do Users Spend On Facebook Daily?
The average amount of time that people spend on Facebook daily is 35 minutes. With potential customers having to spend this amount of time on Facebook daily, businesses can use it as an opportunity to reach them through this platform.
4. What Is Facebook’s User Demographics Statistics?
Every business has a target audience which is why it pays to know how many of them are on the certain platform you are targeting. According to data gathered by Statista, out of the large number of active users that Facebook has, 18.4% of them are male aged 25 to 34 years old and only 12.6% of that age range are female. This means that the largest group of Facebook users worldwide are millennials with ages 25 to 34 years old and the majority of them are male. The second-largest age groups on this platform are 18 to 24 years old which is composed of 13.3% male and 9.3% female.
5. How Many Businesses Use Facebook?
With the pandemic causing huge changes to the usual face-to-face interactions, many businesses across the globe have turned to online platforms to reach their target market. As people continued to flock to different social media platforms, businesses from various industries also used this as an opportunity to market their products and services. This has led to more than 200 million businesses, mostly composed of small businesses all over the world, making use of Facebook and its free tools to market their brand and reach their customers. And out of the total, 93.7% of businesses are actively using Facebook.
6. What Are The Types Of Facebook Content That Can Drive Engagement?
For every business, knowing the right kind of media to include in the content you post is important because this helps drive audience engagement. The global statshot report by DataReportal in October 2021 shows that links make up 49.9% of the total page post, while photo posts account for 32.6% and video posts stand at 16.7%. There were some significant changes in the average percentage of posts seen on a Facebook page because posts with images got the majority of the total percentage in the previous year but it has now fallen second to link posts.
7. How Do You Engage People Using Video Content On Facebook?
It is important to know how you can properly engage your target audience using the content you post. Although most of the posts shared on Facebook are images, you can’t deny the engagement that video content drives in, especially if it holds something interesting and relevant to the audience.
According to Socialinsider, out of all the video formats, vertical videos with a 10-word caption or less reign supreme in increasing engagement rates from 0.29% to 0.44%. Landscape was the most used format by many brands last 2020, however, the vertical video format took a rise in March 2021. In addition, the ideal video length to get better engagement for your brand on Facebook is between 2 to 5 minutes.
8. How Many Facebook Users Visit A Local Business Page Weekly?
Two-thirds of Facebook users across different countries visit a local business page at least once a week. Knowing how many potential customers visit your page in a week helps you set it up in a way that will better represent your brand — what your products and services are all about.
If you’re looking for someone to help you with the Facebook marketing of your business, contact us today, and we’ll be glad to help you!